EFA的目标是通过发掘隐藏在数据下的一组较少的更为基本的无法观测的变量,来解释一组可观测变量的相关性。这些虚拟的、无法观测的变量称为因子。模型的形式:xi=a1f1+a2f2+a3f3+…..+apfp+u
其中xi为第i个可观测变量,fi为公共因子,u为xi变量独有的部分(无法被公共因子解释)。
第一步:本文中使用ability.cov(112个人参与的六个测验)提供的变量的协方差矩阵,因为相关矩阵才符合因子分析的条件,使用cov2cor()函数时期转化为相关系数矩阵。代码如下:
ability.cov$cov
general pictureblocks mazereading vocab
general24.641 5.99133.520 6.02320.755 29.701
picture5.991 6.70018.137 1.7824.936 7.204
blocks33.520 18.137 149.831 19.42431.430 50.753
maze6.023 1.78219.424 12.7114.757 9.075
reading20.755 4.93631.430 4.75752.604 66.762
vocab29.701 7.20450.753 9.075 66.762135.292
>options(digits=2)
>cov<-ability.cov$cov
>cor<-cov2cor(cov)
> cor
general picture blocks maze reading vocab
general1.000.47 0.550.340.58 0.51
picture0.471.00 0.570.190.26 0.24
blocks0.550.57 1.00 0.450.350.36
maze0.340.19 0.451.000.18 0.22
reading0.580.26 0.350.181.00 0.79
vocab0.510.24 0.360.220.79 1.00
第二步:判断公共因子个数
library(psych)
>library(psych)
>fa.parallel(cor,n.obs=112,fa="both",n.iter=100,main="Scree plotswith parallel analysis")

因为代码中使用fa=”both”,图形展示了主成分分析和因子分析的结果。
因子分析建议提取两个因子。碎石检验(三角形)都在拐角处之上,并且大于基于100次模拟数据矩阵的特征值均值。对于EFA,K-H准则的特征值数大于0,而不是1.
第三步:提取公共因子
本文提取公共因子的方法是主轴迭代法(fa=”pa”)
使用fa(r,nfactors=,n.obs=,rotate=,scores=,fm=)
r为相关系数矩阵,n.obs=观测数(输入相关矩阵时已填写),scores为是否计算因子得分。
>fa<-fa(cor,nfactors=2,rotate="none",fm="pa")
> fa
Factor Analysis usingmethod = pa
Call: fa(r = cor,nfactors = 2, rotate = "none", fm = "pa")
Standardized loadings(pattern matrix) based upon correlation matrix
PA1PA2h2 u2com
general 0.75 0.07 0.57 0.432 1.0
picture0.52 0.32 0.38 0.623 1.7
blocks0.75 0.52 0.83 0.166 1.8
maze0.39 0.22 0.20 0.798 1.6
reading 0.81 -0.51 0.910.089 1.7
vocab 0.73 -0.39 0.690.313 1.5
PA1 PA2
SSloadings2.750.83
ProportionVar0.460.14
CumulativeVar0.460.60
Proportion Explained0.770.23
CumulativeProportion0.77 1.00
PA1 PA2
Correlation of scoreswithfactors0.96 0.92
Multiple R square ofscores withfactors0.93 0.84
Minimum correlation ofpossible factor scores 0.86 0.68
两个因子解释了六个心理学测试的60%的方差。此时因子载荷矩阵的意义不好解释,这时使用因子旋转有助于因子的解释。
第四步:下面分别使用正交旋转和斜交旋转来旋转两个因子的结果。
1.正交旋转提取因子
>fa.varimax<-fa(cor,nfactors=2,rotate="varimax",fm="pa")
>fa.varimax
Factor Analysis usingmethod = pa
Call: fa(r = cor,nfactors = 2, rotate = "varimax", fm = "pa")
Standardized loadings(pattern matrix) based upon correlation matrix
PA1 PA2h2u2 com
general 0.49 0.57 0.57 0.432 2.0
picture 0.16 0.59 0.380.623 1.1
blocks0.18 0.89 0.83 0.166 1.1
maze0.13 0.43 0.20 0.798 1.2
reading 0.93 0.20 0.910.089 1.1
vocab 0.80 0.23 0.690.313 1.2
PA1 PA2
SSloadings1.83 1.75
ProportionVar0.30 0.29
CumulativeVar0.30 0.60
正交旋转人为的强制两个因子不相关,由因子载荷矩阵可得,reading与vocab与第一因子上载荷较大,picture、blocks、maze在第二个因子上载荷较大。而general在两者之间比较平均。
2.斜交旋转提取因子
当允许两个因子相关时,用这种方法。
>fa.promax<-fa(cor,nfactors=2,rotate="promax",fm="pa")
> fa.promax
Factor Analysis usingmethod = pa
Call: fa(r = cor,nfactors = 2, rotate = "promax", fm = "pa")
Standardized loadings(pattern matrix) based upon correlation matrix
PA1PA2h2 u2com
general 0.36 0.49 0.570.432 1.8
picture-0.04 0.64 0.38 0.623 1.0
blocks-0.12 0.98 0.83 0.166 1.0
maze-0.01 0.45 0.20 0.798 1.0
reading1.01 -0.11 0.91 0.089 1.0
vocab0.84 -0.02 0.69 0.313 1.0
PA1 PA2
Withfactor correlations of
PA1 PA2
PA1 1.00 0.57
PA2 0.57 1.00
斜交旋转,因子分析会考虑三个矩阵:因子结果矩阵、因子模式矩阵、因子关联矩阵。
结果的第一个矩阵中PA1和PA2栏组成因子模式矩阵,他们是标准化的回归系数而不是相关系数。
第二个矩阵PA1和PA2的相关系数为0.57,相关性很大。如果相关性不大的话需要使用正交旋转的方法。
因子结果矩阵(因子载荷矩阵)并没有直接给出。通过以下函数得出
fsm<-function(oblique){
if(class(oblique)[2]==”fa”&is,null(oblique$phi)){
warning(“object doesn’t look likeEFA”)
}else{
P<-unclass(oblique$loading)
F<-p%*%oblique$phi
colname(F)<-c(“PA1”,”PA2”)
return(F)
}
}
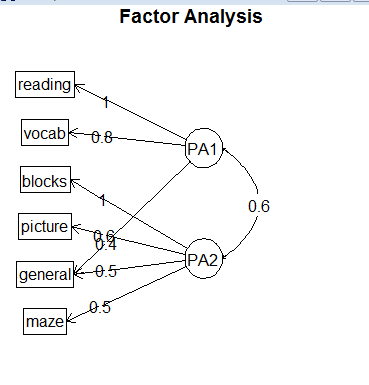
第五步:画出正交旋转的图形
factor.plot(fa.promax,labels=rownames(fa.promax$loadings))
> fa.diagram(fa.promax,simple=F)
数据集ability.cov中心理学测试的两因子斜交旋转结果图
 爱华网
爱华网


