一、线型设置:
% 程序1. 线型设置:
t=0:.1:8;
[ax,h1,h2]=plotyy(t,sin(t),t,cos(t));
set(h1,'linestyle','-','marker','o','color','r');
set(h2,'linestyle',':','marker','x','color','b');
%=========================================================
二、加注图例:
% 程序2.加注图例:
x=linspace(0,2*pi,40);
[ax,h1,h2]=plotyy(x,sin(x)+cos(x),x,exp(x));
set(h1,'linestyle','-')
set(h2,'linestyle','-')
set(h1,'marker','o')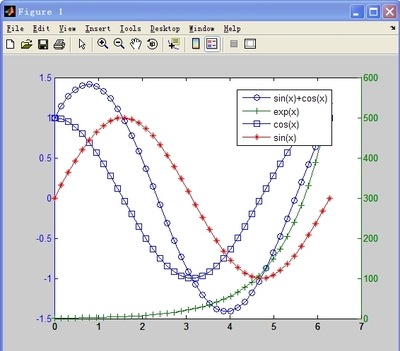
set(h2,'marker','+')
hold on
x=linspace(0,2*pi,40);
hh=line(x,cos(x));
set(hh,'linestyle','-')
set(hh,'marker','s')
hold on
hhf=line(x,sin(x));
set(hhf,'color','r')
set(hhf,'linestyle','-')
set(hhf,'marker','*')
legend([h1,h2,hh,hhf],'sin(x)+cos(x)','exp(x)','cos(x)','sin(x)',0);
%========================================================
三、坐标轴标注:
% 程序3.坐标轴标注:
figure;
t=0:.1:3*pi;
[H,Ha,Hb]=plotyy(t,sin(t),t,exp(t));
d1=get(H(1),'ylabel');
set(d1,'string','yayacpf');
d2=get(H(2),'ylabel');
set(d2,'string','bbs from hit','fontsize',18);
%============================================
From:http://www.eetop.cn/blog/html/11/317611-13768.html
 爱华网
爱华网