The table below gives information about changes in modes of travel in England between 1985 and 2000.

Summarize the information by selecting and reporting the main features, and make comparisons where relevant.
通过人均一年中以不同交通方式旅行的距离对比,该图表反映了英国人常规旅行方式在1985-2000十五年间的变化。
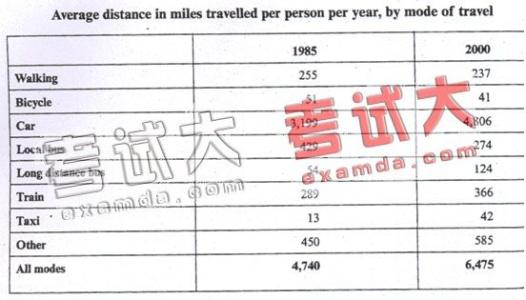
Through comparison of figures of the average distance traveled per person per year in different modes of transportation, the table indicates the changes that occurred to some common ways of travel by the English people over a span of 15 years from 1985 to 2000.
图表显示:步行、骑自行车、乘公交三种交通方式呈下降态势,其它方式皆呈现不同幅度的上升态势。
As is indicated in the table, three modes of travel including walking, bicycling, and taking local bus showed a trend of decline while the rest revealed a general trend of rise, though the margins of rise differed.
首先,我们看到,全年人均步行距离从1985年的255英里下降到2000年的237英里。骑自行车旅行的距离平均降幅为10英里;坐公交旅行的里程数降幅最大,为155英里。
First of all, we see that the average walking distance of people dropped from 255 miles in 1985 to 237 miles in 2000. The average distance of traveling by bike decreased by 10 miles while that by local bus saw the greatest drop by 155 miles.
 爱华网
爱华网


